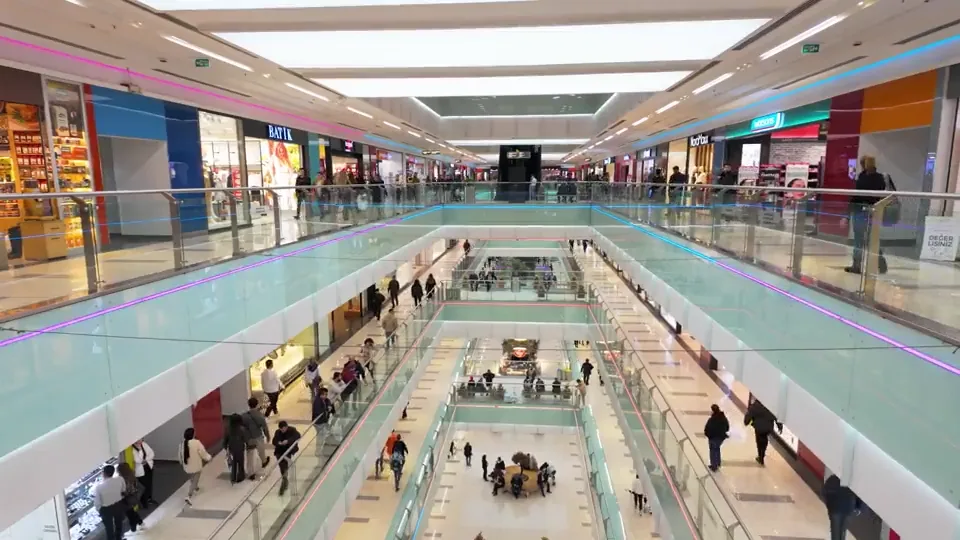
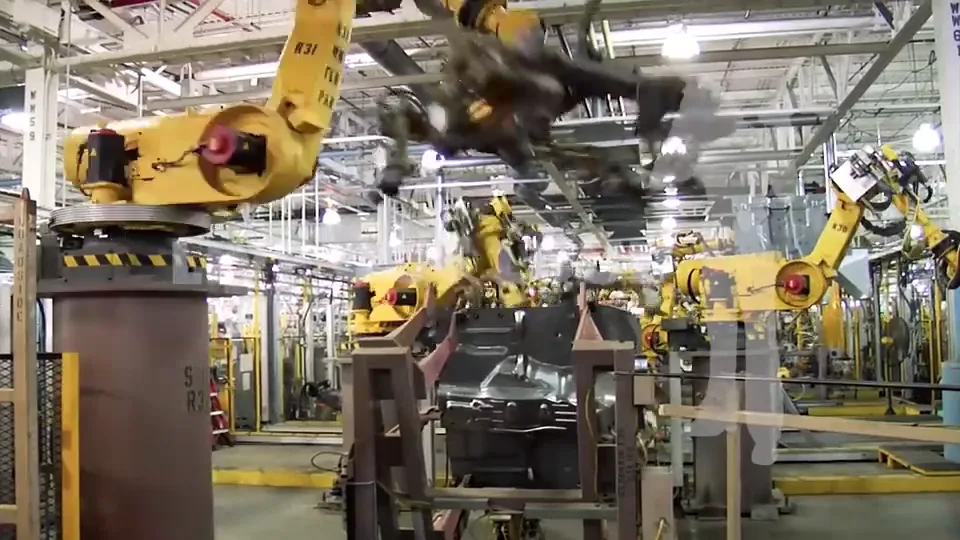
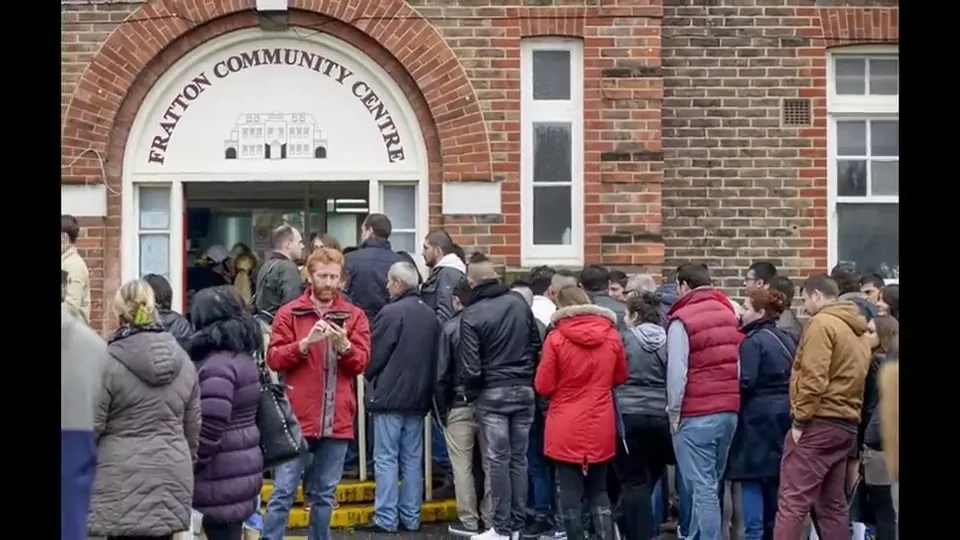
LearnHaus research series

The impacts of AI

Eight research sites on what AI gives and what it costs, one for each factor of the NEESSHEGI model. Every figure carries a source and a confidence label.

NEESSHEGI

NEESSHEGI is the LearnHaus model for evaluating social impact: eight impact factors, with Natural Environment supplying the first two letters. Each factor has its own site. It opens on a headline figure and works through the evidence on both sides; where no verified figure exists, it says so instead of estimating.

Research summaries and confidence labels below come from the original series. Source counts describe that series; open the source notes for its evidence and methods.

01Ground Truth110 sources · 27 findings

NaturalEnvironment

Earth-based, non-human, living and non-living systems across the hydrosphere, geosphere, atmosphere, biosphere and cryosphere.

Headline figure 552t Tonnes of CO₂e emitted training one model, GPT-3, on 1,287 MWh of electricity. Patterson et al. (Google), 2021 · Corroborated Source notes ↗

Compute exploded

The computation used in deep-learning research doubled every few months, an estimated 300,000× increase from 2012 to 2018.

Then it drank

Training GPT-3 in Microsoft's US data centres could directly evaporate 700,000 litres of clean freshwater, and that figure was not disclosed.

And it keeps growing

Global data-centre electricity demand is set to more than double to about 945 TWh by 2030, growing nearly 12% a year from about 1.5% of world electricity today.
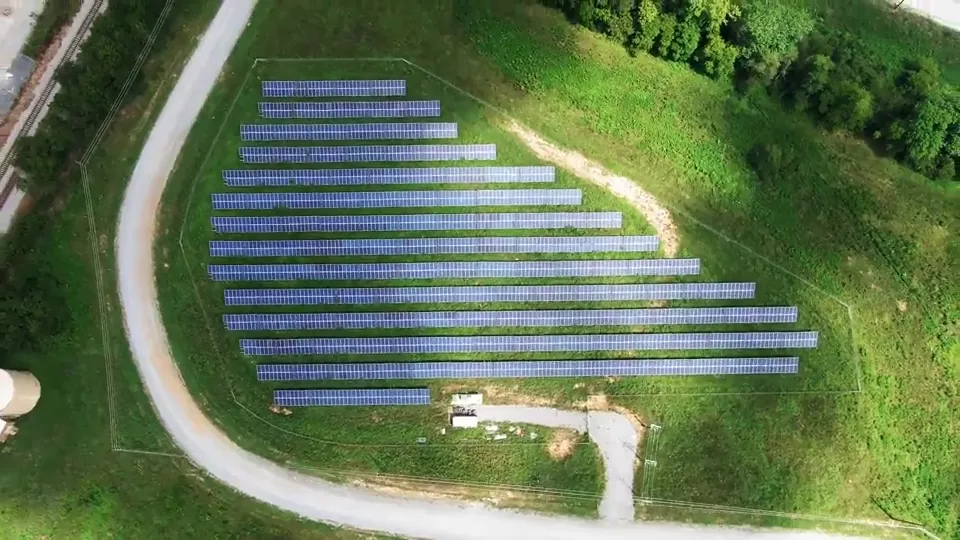
What efficiency buys

The cheap fix works

Better practice, cleaner grids and leaner serving: how far the footprint per job can fall.

1000×Less CO₂ from training, following four best practices
<15%Of Google's energy use went to ML, three years running

What it costs

The bill is already due

Water per chat, carbon built into the hardware, cooling, data growth and compute sited where water is scarce.

500mLA bottle of water for every 10–50 GPT-3 responses
74%Of Apple's total emissions come from making its hardware


Which curve is faster?

Both sides of this page are drawn to the same standard on purpose. Every figure carries its source and a confidence label; where no verified figure existed, the page says so rather than estimating. Whether efficiency outruns growth is not ours to hand you.

Open Ground Truth
02The Current Bill105 sources · 30 findings

Energy

Sources and production, renewable and non-renewable; storage; distribution and transmission; and consumption in homes, business, industry and transport.

Headline figure 945TWh Projected data-centre electricity demand by 2030, more than double the 415 TWh used in 2024. IEA, cited in Chen et al., 2025 · Corroborated Source notes ↗

The grid is already full

Data centres drew 415 TWh in 2024, about 1.5% of world electricity, and demand is growing roughly 12–15% a year: several times faster than electricity demand overall.

Then it doubles

Forecasts converge on +128% by 2030, from 415 to 945 TWh. Of the 210 GW of generation planned to replace retiring plants and meet new load, DOE finds only 22 GW will be firm, dispatchable capacity.

The power arrives late

The median interconnection wait is now 5 years, up from under two a decade ago, with over 2,300 GW of generation and storage stalled in US queues.

The build-out

What the build-out buys

Efficiency, clean-power contracts, privately paid transmission and flexible load: the gains the research can put a number on.

13.7×Training-energy cut, TPUv4 vs. 2017 GPU
34GWClean power under contract, Microsoft & Amazon
The bill

What the bill looks like

Emissions, water, capacity prices, permits and land: the costs, measured at the same weight as the gains.

24–44MtAdded US CO₂e a year from AI servers by 2030
200–300bn galAdded US water use a year by 2030

Who pays the difference?

Both sides above are real. The gains are measured in performance per watt; the costs in ratepayer bills, withdrawn water and permitted gas. Nothing here decides which matters more: that judgement sits with whoever reads the tariff filing. Every figure carries its source and its confidence; where the record was silent, this page says so rather than estimating.

Open The Current Bill
03Common Ground115 sources · 30 findings

Socio-culture

Individual and group language, ethnicity, religion, values, traditions, customs and gender.

Headline figure 90% Share of English in the pretraining data behind GPT-3, Llama 2 and Claude 2. Nayeem & Rafiei, 2026 · Corroborated Source notes ↗

Culture travels

660 million people use one AI companion app, XiaoIce, alongside Chai (4 million active users) and Replika (2.5 million): software built in one place, woven into daily emotional life everywhere.

The flow narrows

Only 20% of the world's population speaks English at home, yet nearly half of the training data for major AI models is in English.

Both are true

73% of AI experts expect the technology to improve how people do their jobs; 23% of the US public agree. A 50-point gap over the same technology.

What exchange gives

Contact makes people legible

Sketches, translations, creative tools and softer arguments: what AI adds when cultures meet.

2.6bnHuman sketches from 236 countries, analysed
110Languages added to Google Translate in one year
What it costs

Sameness arrives quietly

Shared models, vanishing languages, convincing fakes and companions standing in for people.

24MDownloads of one model, BERT, in a single month
300First-language Mvskoke speakers left, nearly all over 60

Who decides what survives?

The exchange is real and so is the concentration. Both sides of this page are sourced to the same standard: every figure carries its origin and a confidence label, and where no verified number exists the page says so. What the numbers cannot tell you is which losses were chosen and which were simply allowed.

Open Common Ground
04AI and the Ledger105 sources · 28 findings

Socio-economics

Individual and group education level, occupation, income, wealth, housing, status, ownership, birth (zip code), job and food insecurity, employability and promotability.

Headline figure $7T What generative AI could add to global GDP over ten years, in Goldman Sachs' forecast. Goldman Sachs 2023, cited in Acemoglu (MIT Economics), 2025 · Corroborated Source notes ↗

Somebody’s shift changes

Around 80% of the US workforce could have at least a tenth of their tasks affected by large language models, and about 19% at least half.

Most jobs are exposed

Almost 40% of global employment is exposed to AI, replacing some work and complementing the rest, with advanced economies facing both more risk and more opportunity.

The catch is uptake

Only 5% of US businesses use AI in producing goods and services, though about 28% of individuals say they use generative AI for their job.

The upside

Already on the books

Annual value, measured productivity, record investment and adoption: the gains already counted.

$4.4TA year from generative AI, at the top of McKinsey's range
14%More customer issues resolved per hour with an AI assistant
The risk

Who pays the difference

Jobs exposed, inequality widened, incomes squeezed and routine work thinned out.

300MFull-time jobs that could be automated globally
50–70%Of the rise in US wage inequality attributed to automation

A ledger has two columns

Projections are not outcomes. Where sources disagree, both are printed here; where a figure is company-reported, contested or single-source, it says so. Every statistic carries its origin and its confidence label.

Open AI and the Ledger
05The Waiting Room124 sources · 28 findings

Health care

Individual and group health and wellness: access, equity, quality and delivery of care, affordability, and infant and maternal mortality and morbidity.

Headline figure 7M Patients on the NHS England waiting list, beside roughly 100,000 unfilled staff vacancies. BBC News, 2025 · Corroborated Source notes ↗

The queue is the system

3 in 4 patients surveyed say they have waited too long to see a specialist, with their longest wait averaging 56 days.

Paperwork eats the hours

Physicians spend nearly two hours on electronic health records for every hour of direct patient care, much of it after the clinic closes.

Patients go around it

About one in six adults (17%) already ask AI chatbots for health information and advice at least once a month.

What earlier access buys

Seen sooner, treated cheaper

Diagnosis, detection, decision support and drug discovery: the gains the research can put a number on.

80%On complex cases, against 20% for physicians alone
0.435F1 detecting pneumonia, against 0.387 for radiologists
What the wait costs

The wait is a treatment

Bias in triage, errors in the notes, misinformation on request and tools priced beyond reach.

43.8%Of triage decisions flipped by changing gender alone
18.5%Of flagged AI-scribe safety issues were medication errors

Who decides what a wait is worth?

Both sides of this page are measured to the same standard and given the same weight. Every figure carries a source and a confidence label; where none existed, the page says so instead of estimating. The trade-off is real; what it should cost a patient is not a number this research can supply.

Open The Waiting Room
06Open Book105 sources · 29 findings

Education

Availability, quality, equity and outcomes of learning from early childhood to adult and lifelong, across the eight levels that shape human capital, skills and capabilities.

Headline figure 95% UK undergraduates who use AI in at least one way, up from 66% in 2024. Stephenson & Armstrong 2026; Freeman 2025, cited in Hossain et al., 2026 · Corroborated Source notes ↗

Nearly everyone is enrolled

86% of 3,800 university students surveyed across 16 countries already used AI for their studies in 2024.

Enrolment is not learning

57% of the world's 50 top-ranked universities had issued guidance on generative AI, mostly telling students to acknowledge and cite it rather than how to use it well.

And the policing misfires

Fourteen AI-text detectors tested scored below 80% accuracy overall; about a fifth of AI-written passages passed as human, and about half escaped detection once edited.

What schooling gains

Every year of school still pays

Faster work, tutoring that reaches further, and capability that now fits in a pocket.

14%More issues resolved per hour with an AI assistant
0.36SDTest-score gain from a WhatsApp maths tutor
What it costs

Somebody is carrying the bill

False accusations, missing teachers, untrained staff and productivity that only feels faster.

61.3%False-positive rate on non-native speakers' essays
15MExtra teachers needed worldwide by 2030

Which of these numbers would change your vote?

Both sides of this page are sourced to the same standard: a figure, a unit, a citation and a confidence label. We have not weighted them for you, and where the research could not answer, the card says so rather than filling the gap.

Open Open Book
07The Fine Print110 sources · 26 findings

Government

City to continent; executive, judicial and legislative roles; the quality and capacity of governance, regulation, policy, law, tax, elections and checks and balances.

Headline figure $90B US federal technology spend a year; 75% goes to keeping legacy systems running. Mehr, Harvard Ash Center, 2025 · Single-source Source notes ↗

The staff is leaving

Fully one-third of the Social Security Administration's workforce of nearly 22,000 was expected to retire by 2022, while citizens ask for more digital government.

The service moved online

Where one AI platform ran social insurance, 71% of requests were filed online, against 28% before it, and individual tasks took about 93 seconds to process.

Nobody can audit it

21 experts in AI, policy and disinformation rated technical deepfake detection the least effective defence, at about 3.4 out of 7.

What the spending buys

Service reaches people

Participation, faster casework, self-service and translation: what government AI delivers when it works.

500%Rise in participatory-budget turnout on a digital platform
2.92MSocial-insurance cases served with 37.5% of the staff
What it costs

The same tools narrow the field

Risky vendors, synthetic images, a few superspreaders and surveillance inside democracies.

$200MPentagon contract ceiling for xAI, days after a public incident
12%Of 2024 US election images shared on X that were AI-generated

What would you need to know?

Both sides of this page are sourced to the same standard: every figure names its origin and its confidence, and where no verified number exists the page says so. If the missing records were published tomorrow, which of these numbers would you expect to move?

Open The Fine Print
08Under Stress105 sources · 26 findings

Infrastructure

Availability, condition, capacity, accessibility, resilience and sustainability of the physical and digital systems for transport, water, sanitation, telecoms, construction and logistics.

Headline figure 2,600GW Generation and storage capacity stuck in US grid interconnection queues in 2023. Microsoft, 2026 · Single-source Source notes ↗

The network is older than its users

Power delivery is built to last 15–25 years. Racks have gone from under 20 kW in the web era to more than 150 kW today, with roadmaps approaching 1 MW by 2027.

Demand climbs faster than capacity

The IEA projects datacentre electricity use roughly doubling from 485 TWh in 2025 to about 950 TWh by 2030, with AI-focused facilities tripling.

And the repair bill compounds

Bringing one leading-edge chip fab to the US rather than Taiwan costs roughly $3–5 billion in incentives; in ten years it will cost about three times as much.

What investment returns

Money spent early pays twice

Better chips per watt, smarter power, light instead of copper: the returns the hardware research can measure.

2.7×Performance per watt, TPU v4 over TPU v3
15%Energy saved by workload-aware GPU power profiles
What decay costs

Deferral is a loan at bad rates

Costly memory, slow fabs, networks that collapse under new workloads and power capacity left stranded.

5–10×More expensive per bit than ordinary DRAM: HBM
918daysAverage to build a US chip fab, up 38% since the 1990s

Which bill would you rather pay?

Both sides of this page are real and both are partial. Every figure carries its source and a confidence label, and where no verified number exists the page says so rather than approximating one. The judgement is yours.

Open Under Stress

The original corpus

The original research series indexes 879 documents from 39 publishers, 2012 to 2026. This local edition includes its eight-factor overview and guided reflections. Explore the original corpus ↗.

Research sites
8
Environment to infrastructure, one domain per site
Source documents
879
Papers, reports and whitepapers, each with a link
Quantified findings
220+
Each with a source and a confidence label
Published 2025–26
69%
Of the corpus is from the last two years

Sources by domain

Documents behind each site

  1. Environment 110
  2. Energy 105
  3. Socio-culture 115
  4. Socio-economy 105
  5. Healthcare 124
  6. Education 105
  7. Government 110
  8. Infrastructure 105

Sources by year

Publication year, 2012–2026

Sources by publication year
YearSources
20121
20132
20141
20150
20163
20172
20185
201910
202013
202121
202227
202358
2024129
2025268
2026339

Most-cited publishers

Top six of 39

PublisherDocuments
arXiv / Cornell University530
Academic Research Publication / Institutional Whitepaper173
Frontiers37
ACM32
Elsevier11
Center for Security and Emerging Technology (CSET) / Georgetown10

Companion study · SocRAITes

Frontier AI security & provider accountability

The ten most common security failure modes across 2,311 research papers, mapped to the frontier AI providers that fail to counter them.

2,311Papers
10Failure modes
7Providers
Open the audit
Demo site